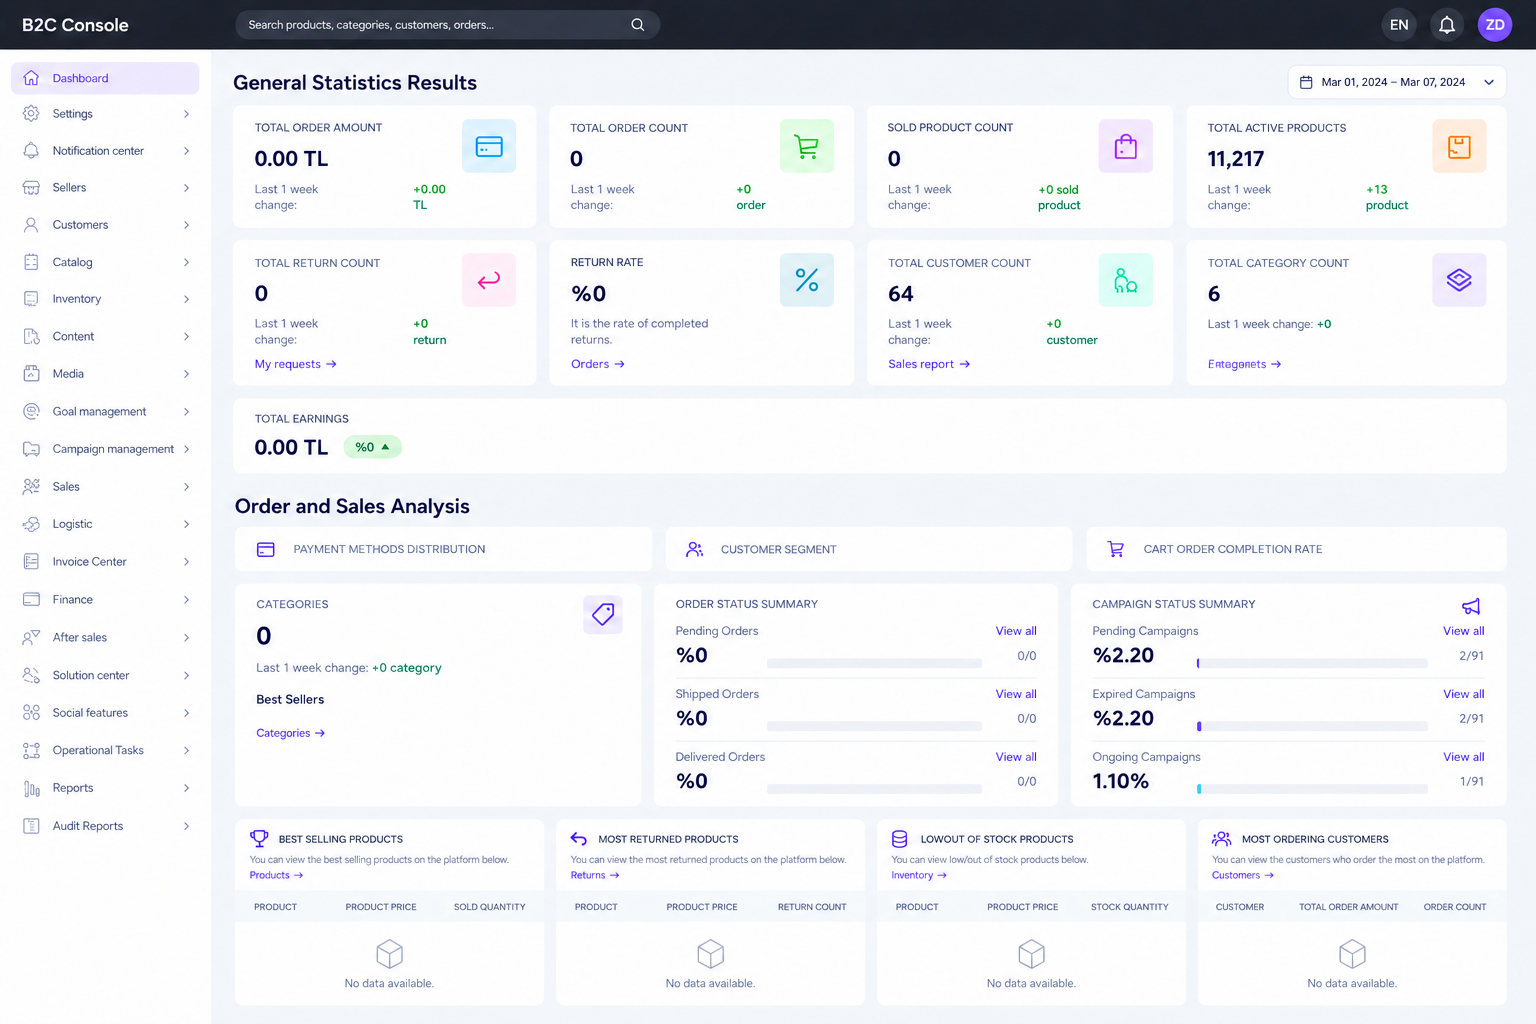
Lidia B2C Console provides a centralized administrative environment for managing day-to-day B2C commerce operations. After signing in, users are directed to the homepage, where they can monitor key business indicators, access operational modules through the left navigation menu, and manage their account and organization-related settings from a single interface.
Homepage
The Homepage is the first screen displayed when users
access the Lidia B2C Console. It provides a centralized
overview of the main operational and commercial indicators of the B2C
business, allowing users to quickly monitor sales, orders, customers,
products, returns, campaigns, and inventory-related information.
Users can select a date range to review performance for a specific
period and use the dashboard summaries to access the relevant
operational areas of the Console.
Homepage Sections
01
General Statistics
Provides a high-level overview of key B2C metrics, including
total order amount, order count, sold product count, active
products, returns, customers, categories, and total earnings
.
Where applicable, changes compared with the previous week are also
displayed.
02
Order and Sales Analysis
Provides analytical information about commerce performance through
areas such as
payment method distribution, customer segments, and cart order
completion rate
,
helping users evaluate customer and sales activity.
03
Category Performance
Provides an overview of category-related activity and enables users
to access best-selling category information to
better understand product performance across the catalog.
04
Order Status Summary
Summarizes the current distribution of orders across key stages,
including
pending, shipped, and delivered orders, providing
quick visibility into order fulfillment activity.
05
Campaign Status Summary
Displays the current status of campaign activities, including
pending, expired, and ongoing campaigns, enabling
users to monitor campaign distribution directly from the dashboard.
06
Product Insights
Highlights operational product information through sections such as
Best Selling Products, Most Returned Products, and Low Out of
Stock Products
,
helping users identify important product and inventory trends.
07
Customer Insights
Displays Most Ordering Customers based on order
activity, allowing users to quickly identify customers with the
highest order volume and total order amount.
08
Date-Based Performance View
Allows dashboard data to be reviewed for a selected
date range, enabling users to evaluate commerce
indicators and operational performance for a specific period.
Left Navigation Menu
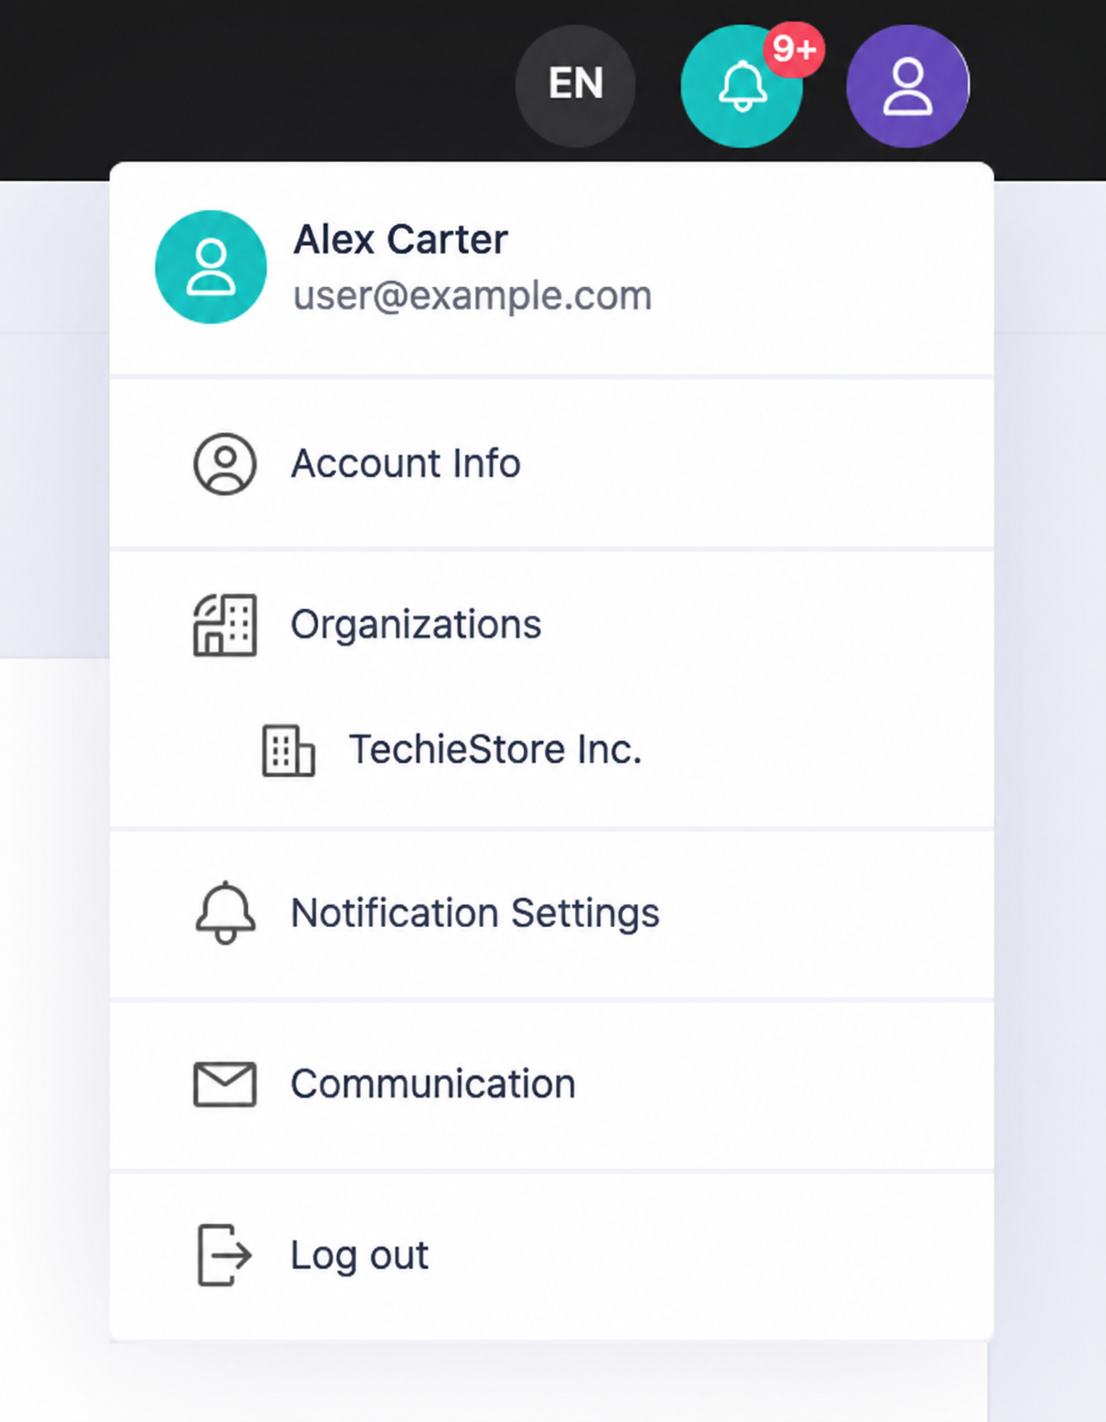
Account settings can be accessed from the profile menu located in the
upper-right corner of the Lidia B2C Console.
Users can manage their personal profile information, update account
preferences, switch between available organizations, and change the
supported interface language where applicable.
The following account information can be updated:
Profile picture
First and last name
Email address
Phone number
Password
The Organization Details section contains the primary
company and contact information associated with the active organization
in the Lidia B2C Console.
Depending on user permissions, authorized users can view or manage
organization information and organization users.
View and update company information
Manage organization users
View company type and integration information
Manage tax and registration information
View and update address information
Manage organization contact information
Notification Settings
Provides quick access to the notification configuration area of the
Lidia B2C Console, where users can manage available notification-related
preferences.
Communication
Provides access to communication channels that allow users to contact
the Lidia teams when assistance or support is required.
Note: Organization management options may vary depending
on the permissions assigned to the user.